Saturday, June 30, 2012

Performance

Vacation Alert:  The Night Owl is a self-confessed Olympaholic.  Whenever the Olympics come on TV, I'm there.  I watch the sports I really like, like volleyball, the sports I don't really care for like basketball, and the sports I ordinarily wouldn't even think about, like rowing, weight lifting, or watching big guys hustling around a track, tossing cannon balls or chucking spears.  All of which is to note that the Olympics is coming right up in July.  So for two weeks, I'll be on vacation and glued to my TV set.  I know it's crazy, but I hope my readers will indulge me a little time off.  Thanks!

Performance:

Here are my performance stats for the first six months of 2012.  The first two columns are for my trading account.  The next, "ESFT", is the ES Fantasy Trader.  Following that I've now added the results for my IRA.  The last is the Dow, my reference benchmark that I try to match or beat.


 Date    Trading, Month  Tr. YTD  ESFT YTD   IRA YTD   Dow YTD
1/31/12       7.41%        7.41%   -0.50%     6.18%     3.41%
2/29/12       3.67%       11.35%    7.88%     9.02%     6.02%
3/31/12       1.76%       13.31%   29.88%    10.05%     8.16%
4/30/12       2.35%       15.97%   41.75%    10.90%     8.17%
5/31/12      -1.92%       14.23%   26.63%     4.91%     1.45%
6/30/12       4.33%       19.17%   40.38%     2.80%     5.44%

It's not often that people are willing to share their results online, so here's a few I noticed this past week:

"My conservative-growth portfolio is currently up 11.9% year-to-date, while my aggressive portfolio is up 14.1%. By contrast, the S&P is up just 6.2% so far this year. I try to keep about 25 positions in each of these portfolios at any given point in time."


"Sound Advice’s record reflects its recent rally. Over the year to date through May, the letter is up 6.4% by Hulbert Financial Digest count versus 5.08% for the dividend-reinvested Wilshire 5000 Total Stock Market Index."


By any metric, I'd say we're doing pretty well.  In fact, at the current rate this would be my best year yet.  I was up just over 30% in 2009 and 2010 and down 1% last year.  Right now, we're on track for a 38% year.  I know, I shouldn't say anything, but the numbers are what they are  Actually, even a 19% return is pretty good for a whole year, and I'm seriously considering just taking the rest of the year off... nah, who am I kidding - I'm hooked :-).

Friday, June 29, 2012

Friday higher

The Hoot 
Actionable ideas for the busy trader delivered daily right up front
  • Friday higher, low confidence.
  • ES pivot 1319.00.  Holding above is bullish.
  • Next week bias uncertain technically.
  • Monthly outlook: bias down.
  • ES Fantasy Trader standing aside.
Recap

Whoa!  In what has to be the greatest comeback since Lazarus, the Dow which was down 176 points at 2:30 PM and headed lower after an ugly open, rallied furiously to recoup all but 25 points of that in the last 90 minutes of trading, a move that turned my own day from a loser to a winner.  The boards are all atwitter about market manipulation, the PPT, fraudsters and banksters, but I'm just happy that my call for a move higher was (almost) redeemed, and I made some money.  DIA actually did end up on the day, though off just a bit from yesterday's close.  With more interesting developments since the close, it should be a very interesting Friday.

And I'll mention that the Blogspot spell-checker has been on the fritz for two days now, so I apologize in advance for any typos.  I try to proofread my text, but there always seems to be a few that slip by.

The technicals

The Dow: This is what I love about the market - there's always something new cooking.  It wasn't a particularly good day for swing trading, but the day traders must have had a field day.  Anyway, when it was all over, we had a tall hanging man.  This is a reversal sign that definitely requies confirmation.  The stochastic, which finally did execute the bullish crossover I mentioned last night, suggests more upside is possible Friday.

The VIX:  Last night I thought we might see a higher VIX on Thursday and so we did, with a 1.34% gain despite a late afternoon drop.  This left us with an inverted hammer and a big drop in the futures that now suggest we might go lower on Friday, and that would be good for stocks.

Market index futures: Tonight, we've got a big jump in all three futures on the European news that came out this evening with ES up 1.12% at 1:20 AM EDT.  Ordinarily, I'd say this would make Friday a slam-dunk, but it's only a few weeks ago that we had an almost identical setup on Spanish bank bailout news, and the rally the next day lasted all of 10 minutes before ending the day lower.  The difference now is in the indicators which are much more oversold than then and in fact are right about the same level as on June 6th, when ES bounced off its 200 day MA.  Also, we now have a bullish trigger on the exit from the descending RTC.

ES daily pivot: Tonight the pivot steps down from 1322.00 to 1319.00.  We crossed over the old number at 10:50 this evening and are now well above the new number.  This is looking good for Friday.

Dollar index: The dollar gapped up today to form the top of an evening star.  And that also brought its indicators well into overbought territory.  This chart looks ready to roll over on Friday.

Transportation: Last night I was very bullish on this chart and it did not disappoint on Thursday, posting a 0.76% gain as opposed to the Dow's 0.2% loss.  All of the factors at work here last night are still in play, only more so.  In particular, we got a bullish trigger off the exit from the descending RTC.  The downtrend that began on 6/20 is over.

Accuracy (daily calls):

Month right  wrong  no call  conditional  batting average points trade
April   7      9      2                        .438
May    10      7      3           2            .632
June    7      6      6           1            .571        354   +$260

     And the winner is...

Tonight I'm seeing a bunch of positive signs in the charts independent of the big move up in the futures, courtesy of those pesky Europeans.  The only hesitation I have is that Friday is the end of the week, the quarter, and the first half of the year and that is historically a very bearish day for the Dow.  But the setups I'm seeing the the VIX and the trans are sufficiently compelling, even absent the big run-up in ES, that I'm ready to call Friday higher.

ES Fantasy Trader

This morning I was glumly watching last night's long trade slowly go down the toilet so I just walked away from my screen and ran some errands.  When I came back, much to my surprise I was nearly back to break-even.  So I decided to let 'er ride.  Then when I sat down to write this post, lo and behold, I was positive by 10.75 points.  Well that was good enough for me and I decided to get out while the getting was good.  Sometimes ya just gotta know when to hold 'em and when to fold 'em.

Portfolio stats: for now the account rises to $140,375 after 48 trades (37 wins, 11 losses) starting from $100,000 on 1/1  Tonight we stand aside since my usual pattern of entering trades late at night and selling during the day has gotten out of phase.  So that's my last trade of the week and the quarter.  Reminder: you can track these trades live on Twitter @nightowltrader.

SLD    10    ES    false    SEP12 Futures     1337.00    USD    GLOBEX    00:51:56   
BOT    10    ES    false    SEP12 Futures     1326.25    USD    GLOBEX    JUN 28 01:50:58   

CUA (Commonly Used Acronyms)

BB - Bollinger Bands
DCB - Dead Cat Bounce
MA - Moving Average
RTC - Regression Trend Channel
YTD - Year To Date

Disclaimer: (My lawyer made me do it) This blog is not trading or investment advice, account management or direction.  All trades listed here are presented only as examples of the author's personal trading style.  Investing entails significant risk and trading entails even greater risks.  Deal with it.

Thursday, June 28, 2012

Thursday maybe higher

The Hoot 
Actionable ideas for the busy trader delivered daily right up front
  • Thursday higher, low confidence.
  • ES pivot 1322.00.  Holding above is bullish.
  • Friday bias higher technically.
  • Monthly outlook: bias down.
  • ES Fantasy Trader goes long at 1326.25.
Recap

There certainly were enough positive signs in the charts last night.  Looking back on it now, I can't figure out why I was so indecisive.  In any case the Dow gave us an impressive 92 point gain for the second green candle in a row.  Can we go for three?  Let's take a look.

The technicals

The Dow: Today's tall green candle was enough to take us decisively out of the descending RTC for a bullish setup.  We'd need to close below 12,437 Thursday to not get a bullish trigger.  That kind of drop doesn't seem likely.  And the stochastic is ever so close to making a bullish crossover now.  I had to look at the numbers, not just the lines to even tell.

The VIX:  Today the VIX dropped again as I suspected, though not by much, losing 1.37% on a gravestone doji that signals a possible reversal higher.  The futures support this idea, having gained 0.84% today.

Market index futures: Two strong back-to-back green candles in ES completely retraced Monday'sbig dump, and the overnight is just barely hanging on as all three futures are ever so slightly in the green at 1:446 AM with ES up just 0.09%.  Nevertheless, today's action traded entirely outside the descending RTC for a bullish setup (almost looks like a trigger) and the bullish stochastic crossover is now complete.  There's nothing in this chart to suggest a move lower.  Technically that is.

ES daily pivot: Tonight the pivot jumps from 1312.25 to 1322.00 even.  We're still above the new number, but by a lot less now as ES continues to basically flat-line in the overnight.  But so far no indication that ES is planning on taking a dive, so this is cautiously optimistic.

Dollar index: The dollar painted a somewhat different picture today.  Yesterday's bearish engulfing pattern was rejected and the dollar actually went up by 0.33%, so it remains in a shallow uptrend.  Look for the dollar to get jerked around by the euro on whatever news comes out of this European summit on Thursday.  No point trying to predict this one.

Transportation: Meanwhile the trans gained today too, though decidedly less than the Dow.  But they did cross right back up over the 200 day MA which now becomes support again, so that's encouraging.  And this close also took us out of the descending RTC for a bullish setup.  And lastly, the indicators have finally hit oversold levels.  Momentum, money flow and OBV have actually started moving back up, a bullish sign, and the stochastic is ever so close to a bullish crossover.  This chart looks more likely to go higher than lower.

Accuracy (daily calls):

Month right  wrong  no call  conditional  batting average points trade
April   7      9      2                        .438
May    10      7      3           2            .632

June    7      5      6           1            .615        379   +$182 

 
     And the winner is...

Well I think Thursday is going to be one of those funny days where news from Europe could jerk the markets around.  Technically though we're actually not looking too bad, so I'm going to go out on the limb again and ever so cautiously call Thursday higher.  But keep one finger on the "sell sell sell" button and watch out for any attempt by ES to break under its pivot.  A word to the wise from the wise old Night Owl.

ES Fantasy Trader

Portfolio stats: with no trade last night the account remains at $135,000 after 47 trades (36 wins, 11 losses) starting from $100,000 on 1/1  Tonight in the absence of any bad news and in view of charts that appear to be at tradeable extremes, we go long at 1326.25.  Reminder: you can track these trades live on Twitter @nightowltrader.

CUA (Commonly Used Acronyms)

BB - Bollinger Bands
DCB - Dead Cat Bounce
MA - Moving Average
RTC - Regression Trend Channel
YTD - Year To Date

Disclaimer: (My lawyer made me do it) This blog is not trading or investment advice, account management or direction.  All trades listed here are presented only as examples of the author's personal trading style.  Investing entails significant risk and trading entails even greater risks.  Deal with it.

Wednesday, June 27, 2012

Wednesday uncertain

The Hoot 
Actionable ideas for the busy trader delivered daily right up front
  • Wednesday uncertain.
  • ES pivot 1312.25.  Holding above is bullish.
  • Rest of week bias uncertain technically.
  • Monthly outlook: bias down.
  • ES Fantasy Trader standing aside.
Recap

Sort of a funny sine-wave shaped day today: down right out the gate, then rising back up later on, followed by a late afternoon sell-off.  When all was said and done though we were still left with a little 32 point gain for the Dow.

The technicals

The Dow: The daily candle here was a spinning top sitting at the low of yesterday's big dump.  This is at least a potential sign of a reversal, though it regquires confirmation.  One possible source of that is the stochasitic which is now flattening out in preparation for a bullish crossover, probably in a day or two, absent any new disasters in Europe.

The VIX:  As I suspected, the VIX dropped today, partly filling yesterday's gap with a 3.24% loss and forming a pattern that's close to a bearish tri-star.  With the VIX back under 20, more gap-filling to go, and basically no support from the futures, I see no reason why we can't go lower again on Wednesday.

Market index futures: All three futures just barely crossed into the green at 1 AM EDT, with ES now up by all of a single tick.  The net result so far is a small dragonfly doji, though the candle is clearly still young.  But just as the failure of ES to push lower in the overnight last night after a big down day was encouraging, the failure to push higher in the overnight after an up day is slightly concerning.  It seems to have made up the early evening sag but gotten stuck at the point of the regular close on Tuesday.

I'll note too that the stochastic, which seemed to be getting ready to form a bullish crossover, has now simply flattened out, which pretty much cancels the signal.  The only remaining cause for hope is that we're now trading outside the descending RTC which would be a bullish setup unless we close under 1307 on Wednesday, which isn't too hard to imagine.

ES daily pivot: Tonight the pivot nudges up from 1311.83 to 1312.25.  The late evening bounce in ES off the old pivot means we're now three points above.  That's bullish on the face of it, but close enough to keep the pivot in play.  We don't want to see ES break below it.

Dollar index: Last night I was looking for an evening star here.  We got something pretty close today as the dollar dropped 0.15%.  And the two day pattern is bearish engulfing, one of the stronger patterns.  Also, the stochastic is just now making a bearish crossover, so everything seems to be lined up for more dollar downside Wednesday, which should help stocks.

Transportation: Last night I was betting that a turn-around in trans was near.  It happened about a day earlier than I expected, but I was right that the break under the 200 day MA yesterday wasn't going to be a big deal.  In fact we eked out a slight gain to close at 5003.33, just above the 200 MA at 5002.55.  This move is encouraging for Wednesday as the indicators continue to approach oversold levels and the stochastic is flattening out in preparation for a bullish crossover, maybe later this week.

Accuracy (daily calls):

Month right  wrong  no call  conditional  batting average points trade
April   7      9      2                        .438
May    10      7      3           2            .632

June    7      5      5           1            .615        379   +$182 

 
     And the winner is...

Hmm, the charts seem to be suggesting a rally sometime soon.  I'm just not convinced it's going to be on Wednesday.  The market seems to be looking for motivation at the moment.  By the same token, we seem to have found some support around Dow 12,500.  This means that I'm not looking for much action Wednesday.  I don't think we'll have a big move either way.  And therefore it's also not clear to me if the close will be higher or lower, so much as I hate to do it I just have to call Wednesday uncertain.  If I absolutely had to guess, I'd say the bias is slightly to the upside.

ES Fantasy Trader

Yesterday evening's long was a, uh well, long shot, but it paid off well enough in the end for a two point lunch-time profit.

Portfolio stats: the account now rises to $135,000 after 47 trades (36 wins, 11 losses) starting from $100,000 on 1/1  Tonight without any clear edge either way, we're simply going to stand aside.  Reminder: you can track these trades live on Twitter @nightowltrader.

SLD    10    ES    false    SEP12 Futures     1312.00    USD    GLOBEX    12:32:21   
BOT    10    ES    false    SEP12 Futures     1310.00    USD    GLOBEX    JUN 25 20:43:10   


CUA (Commonly Used Acronyms)

BB - Bollinger Bands
DCB - Dead Cat Bounce
MA - Moving Average
RTC - Regression Trend Channel
YTD - Year To Date

Disclaimer: (My lawyer made me do it) This blog is not trading or investment advice, account management or direction.  All trades listed here are presented only as examples of the author's personal trading style.  Investing entails significant risk and trading entails even greater risks.  Deal with it.

Tuesday, June 26, 2012

Tuesday higher

The Hoot 
Actionable ideas for the busy trader delivered daily right up front
  • Tuesday higher, low confidence
  • ES pivot 1311.83.  Breaking over is bullish..
  • Rest of week bias uncertain technically.
  • Monthly outlook: bias down.
  • ES Fantasy Trader going long at 1310.00.
Recap

After yesterday's bounce, the downward momentum resumed today handing us a 138 point loss, the second triple digit down day in the last three.  Although technically we're not in a downtrend as I define it (three consecutive days in a row), it's close enough to define a new descending RTC, so I'm setting up the red arrow.

The technicals

The Dow: Today's close at 12,503 brings the 200 day MA back into play at 12,356.  That's easily within a one-day reach given the recent action.  In addition, the lower BB is still a long way away at 12,088 and the indicators are still not even oversold yet.  The one bright spot is that today's down volume, while above average, was still less than Friday's up volume.  But this chart still seems to suggest more downside ahead.

The VIX:  Today the VIX gapped up a big 12.53% to give us a doji star and a potential evening star developing.  We're also outside the last descending RTC so that's a bullish trigger, and the indicators are all just coming off oversold.  So we have something of a mixed message.  My idea is that the evening star may drive the VIX lower Tuesday, but watch for a rebound later in the week.

Market index futures: In something of a rerun of last Thursday evening's action after a big down day, all three futures are currently in the green at 1:50 AM EDT with ES up 0.17%.  And once again, the lack of continued downward follow-through in the overnight is encouraging.  It is particularly interesting that the stochastic is gearing up to form a bullish crossover, and the other indicators are very close to oversold.  I'd say a move higher from here is not out of the question for Tuesday.

ES daily pivot: Tonight the pivot takes a big step down from 1325.58 to 1311.83.  Combined with ES's slow drift higher, and we're really close to the new pivot - less than three points.  While holding under is bearish, we are at least within reasonable striking distance here, and a break above would definitely be bullish.

Dollar index: In a sort of mini-version of the VIX, the dollar gave us a small doji and a potential evening star.  This is already looking ripe for a move lower on Tuesday which would be good for stocks.

$TRAN daily
Transportation: This one is worth a chart.  Here we see how the trans have now been down, pretty steadily four days in a row.  Note how today we dipped below the 200 day MA (the dotted orange line) but recouped to close just barely under it.  We also fell off the left edge of the descending RTC, which can sometimes be bullish.  However note also that the indicators are all still continuing their fall from overbought and have not yet reached oversold.  Therefore, one must conclude that a turnaround is near but perhaps not quite at hand.  Nevertheless, this must make one at least hesitant to put on any new shorts here.  I'd at least consider getting out some long pants instead.

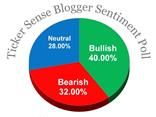
Sentiment: Once again it's time for the latest weekly TickerSense Blogger Sentiment Poll.  We continue to track the poll to see how well it performs.  Here's the updated cumulative list for this year:


Wk.# Week   % Bullish  % Bearish  NightOwl SPX  Accuracy

  1  1/3        46         21        +     1258   1/1
  2  1/9        56         37        +     1278   2/2
  3  1/17       41         33        +     1289   3/3
  4  1/23       46         32        +     1315   4/4
  5  1/30       48         31        +     1316   5/5
  6  2/6        56         30        +     1345   6/6
  7  2/13       48         31        +     1343   7/7
  8  2/21       44         32        +     1361   8/8
  9  2/27       48         24        +     1366   9/9
 10  3/5        43         26        +     1370  10/10
 11  3/12       46         32        +     1371  11/11
 12  3/19       46         29        +     1404  11/12
 13  3/26       39         29        +     1397  11/13
 14  4/2        42         21        +     1408  11/14
 15  4/9        25         46        -     1398  12/15
 16  4/16       26         48        -     1370  13/16
 17  4/23       30         48        -     1379  14/17
 18  4/30       44         32        +     1403  14/18
 19  5/7        23         50        -     1350  15/19
 20  5/14       32         44        -     1353  16/20
 21  5/21       30         52        -     1295  16/21
 22  5/29       35         42        -     1318  16/22
 23  6/4        32         48        -     1278
 24  6/11       28         40        -     1326
 25  6/18       39         26        -     1343  
 26  6/25       38         46        -     1335

Again, the SPX number is the closing price of the S&P on the Friday before each new poll comes out.  The "NightOwl" column is how I voted.  Since the poll is for 30 days out, after the first four weeks we're able to see how well we did.  This week we see that my bearish call on 5/29 was wrong (again), the S&P now being higher than then.  I'm using the column "Accuracy" to track my calls.  So now I'm 16 for 22 .  And of course that means that since I voted with the majority back then, the poll as a whole was also wrong that week.  So with half the year gone now the poll's accuracy drops to 73% YTD, still pretty good.

What's interesting this week is that while the bullish sentiment barely budged, the bearish sentiment nearly doubled.  In fact, bearish sentiment is now at the second highest level of the year so far.  You might expect that to be contrarian bullish, but don't forget that with the year half over already, the poll has been right nearly three quarters of the time.  And for the record, I voted bearish once again for the eighth straight week.  Although the monthly SPX chart is currently showing a doji on a candle that's almost fully cooked, that is not a guaranteed reversal indicator and the stochastic, which works very well in these long time frames, is still less than halfway on its trip from overbought to oversold.  Given its current position, I'd say it should hit bottom around the end of July.

Accuracy (daily calls):

Month right  wrong  no call  conditional  batting average points trade
April   7      9      2                        .438
May    10      7      3           2            .632

June    6      5      5           1            .583        346   +$177

     And the winner is...

While the overall picture doesn't look particularly bright, I'm thinking that the sell-off today was overdone.  With the VIX and the dollar both suggesting the possibility of a reversal on Tuesday, I am going back out onto my limb and calling Tuesday higher.

ES Fantasy Trader

Last night's short worked out well for 14.5 points that left almost nothing on the table.  Portfolio stats: the account now rises to $134,000 after 46 trades (35 wins, 11 losses) starting from $100,000 on 1/1  Tonight we go long at 1310.00 with another early evening entry.  Reminder: you can track these trades live on Twitter @nightowltrader..

BOT    10    ES    false    SEP12 Futures     1305.75    USD    GLOBEX    12:25:20   
SLD    10    ES    false    SEP12 Futures     1320.25    USD    GLOBEX    01:40:04

CUA (Commonly Used Acronyms)

BB - Bollinger Bands
DCB - Dead Cat Bounce
MA - Moving Average
RTC - Regression Trend Channel
YTD - Year To Date

Disclaimer: (My lawyer made me do it) This blog is not trading or investment advice, account management or direction.  All trades listed here are presented only as examples of the author's personal trading style.  Investing entails significant risk and trading entails even greater risks.  Deal with it.

Monday, June 25, 2012

Monday maybe lower

The Hoot 
Actionable ideas for the busy trader delivered daily right up front
  • Monday lower, low confidence
  • ES pivot 1325.58.  Holding under is bearish.
  • Rest of week bias uncertain technically.
  • Monthly outlook: bias down.
  • ES Fantasy Trader going short at 1320.25..
Recap

Friday was an interesting day.  I thought it would depend on the ES pivot.  However, in the end, the Dow gained 67 points even though ES never managed to break above its daily pivot.  That's fairly unusual.  Still my overall expectation of either a doji or a DCB was pretty much met, with the latter.  The big question now is what happens two days after a big drop.  To quote those noted market technicians Led Zeppelin, "Ooh, really makes me wonder".  Let's see if we can build a stairway to heaven this week.

The technicals

The Dow: It's easy to dismiss Friday's 0.53% gain as a DCB.  But I look at the above average volume (and in fact rising for three straight days) and I wonder if the bears really have what it takes to drive this market lower.  Notably, OBV has been rising slowly but steadily since June 4th - not the sort of action you'd expect in a market decline.  On the other hand, the stochastic is pretty much in declining mode.

The VIX:  Friday the VIX put in a bullish harami reversal pattern.  This pattern requires confirmation but we also note that the VIX closed exactly on the edge of the descending RTC, just barely missing a bullish trigger.  The weekly chart though is a giant bearish engulfing pattern, suggesting a lower VIX to come this week.

Market index futures: Tonight all three futures are running the the red at 1:32 AM EDT with ES lower by0.49%.  The developing candle is forming a bearish harami (though technically this pattern should be preceded by a move upward).  Still, the fact that there does not seem to be anything in the way of follow-through developing in the overnight so far suggests something of a lack of enthusiasm for Monday.

ES daily pivot: And tonight the pivot drops from 1329.67 to 1325.58.  After running under the old number all evening, we're still below the new level, just not by quite as much.  Still, with ES basically just meandering, this isn't a particularly encouraging sign.

Dollar index: Dark days for the dollar.  Dark cloud cover to be precise.  Which is the candle the dollar put in on Friday.  Always a good sign of lower to come.  And a lower dollar would be good for stocks, assuming the long-standing but recently tested inverse correlation holds.

Transportation: In a telling bit of divergence, on Friday while the Dow was busy adding on 0.53%, the trans actually fell 0.83%.  Hoot, hoot!! Dow Theory alert!  And to amplify a bit, I'll note that the indicators are all now clearly marching down the slope from overbought.  As pilots stuck in icing like to tell ATC, "looking for lower".

Accuracy (daily calls):

Month right  wrong  no call  conditional  batting average points trade
April   7      9      2                        .438
May    10      7      3           2            .632

June    5      5      5           1            .455        207   +$167


     And the winner is... 


Once again we have a somewhat murky technical situation.  The Dow is sort of confused right now and the VIX is giving at least hints of going higher Monday.  On the other hand, the dollar looks ready to go lower (for higher stocks).  But there's a warning from the trans suggesting lower stocks.  It's not a slam dunk by any means, but I'm going way out on a limb and  leaning to a lower close on Monday.  The balance seems to come down on the minus side - just.

ES Fantasy Trader

Portfolio stats: With no trade last Friday, the account remains at $126,750 after 45 trades (34 wins, 11 losses) starting from $100,000 on 1/1  Tonight we go short at 1320.25.

CUA (Commonly Used Acronyms)

BB - Bollinger Bands
DCB - Dead Cat Bounce
MA - Moving Average
RTC - Regression Trend Channel
YTD - Year To Date

Disclaimer: (My lawyer made me do it) This blog is not trading or investment advice, account management or direction.  All trades listed here are presented only as examples of the author's personal trading style.  Investing entails significant risk and trading entails even greater risks.  Deal with it.