Friday, February 10, 2012

Friday lower

The Hoot 
Actionable ideas for the busy trader delivered daily right up front
  • Friday lower, high confidence.
  • ES pivot 1347.25.  Holding below is bearish.
  • Next week bias uncertain technically.
  • Monthly outlook: bias up.
  • ES Fantasy Trader goes short at 1345.25.
Recap

Last night I was thinking today's action would hang on the news out of Greece.  Well we got some news today, I think, but darned if I can figure out if it was good or bad.  And I guess the market couldn't either, with the Dow ending up just 6.5 points.  What does this all mean for Friday?  Read on, MacDuff...

The technicals

The Dow: For the fourth day in a row, the Dow provided us with another reversal indicator, today a small body star.  But for the first time since January 23rd, the stochastic is forming a bearish crossover.  The 23rd was also a star about the same size as today's.  And the next day then closed lower, down over 100 points in fact from high to low.

Of additional concern is that the SPX Hi-Low index has now spent four days at its extreme level of 100.  The last time this happened was December 7, 2011.  The next day, December 8th, the Dow was down 198 points.

VXX daily
The VIX:  Last night I wrote "I'm thinking the VIX goes higher Thursday" and sure enough, the VIX gained 2.59% today.  But the Chart of the Day is the VIX futures.  Check this out (click the chart to enlarge).  Notice the strong descending RTC with a Pearson's coefficient of 0.984 going back to January 13th.  Then notice how two days ago, the VXX closed just outside the right edge of this channel.

That's the bullish setup.  Then we have the green candle yesterday trading entirely outside the RTC.  That's the trigger.  And then finally today, bang, a gap-up green candle, with the biggest daily gain since last December 28th.  The downtrend in the futures is now definitely over.  Clearly someone thinks the VIX is going up.  This is a very very important move, in my not so humble opinion.  And it is even more significant given that the VIX has a natural tendency to decline on Fridays.  And that's bad for stocks.

I'm not alone in this view either.  The great Rob Hanna in his blog today says, "Implications of the rising VIX and 50-day SPX high appear to be moderately bearish over the next few days, suggesting a pullback."

Market index futures:Right now at 1:17 AM EST, all three futures are in the red, with ES down a significant 0.43%.  It's been a while since we've seen losses of this magnitude at this hour of the night.  Today's action brought us yet another reversal indicator in the form of a small body star but this time, the overnight is providing some confirmation.

Today's candle also fell right on the edge of the rising RTC and now we're trading outside it.  That would be a bearish trigger.  We'd have to rise from 1342, where we are now, to 1355 just to get back in the RTC.  That's not looking likely right now.  The indicators have now all peaked (finally) at overbought levels and the stochastic has completed its bearish crossover.

ES daily pivot: Rose once again tonight from 1344.50 to 1347.25.  But tonight is different.  For the first time in days, we broke under the pivot at 8:20 PM.  Then with ES drifting lower and the pivot rising, we're even further below it now - another bad sign for stocks.

Dollar index: The dollar gave us a doji today warning of a possible move higher on Friday, and that would be bad for stocks.

Morningstar Market Fair Value Index: The index extended its flat streak to four days stuck on 0.96.  The last time we saw a run of four days level like this ended on 11/8./11.  The next day was down 385 points.  Just sayin'.


History: According to The Stock Traders Almanac, Friday is historically just slightly bullish.  But recall that February on the whole is pretty weak and one third of the way through so far we've yet to see any weakness.

     And the winner is...

After a number of days of difficult charts and wishy-washy indicators, tonight we're finally getting some significantly stronger guidance, and it sure looks like it's in a downward direction.  The rise in the VIX futures really rings the alarm bells for me.  I really think the pullback everyone's been waiting for is now on the doorstep.  I even took on a position in DXD (the Dow Ultra Short ETF) this afternoon at 13.62.  So I'm going to call Friday lower.

ES Fantasy Trader

Last night we stood aside from insufficient information to pick a direction.  Tonight though, we're going short at 1345.25.   Portfolio stats: the account remains $108,375 after 11 trades (8 wins, 3 losses) starting from $100,000 on 1/1.

 

Thursday, February 9, 2012

Thursday lower unless good Greek news

The Hoot 
Actionable ideas for the busy trader delivered daily right up front
  • Thursday uncertain: slight negative bias pending Greek news.
  • ES pivot 1344.50.  Holding above is bullish.
  • Friday bias uncertain technically.
  • Monthly outlook: bias up.
  • ES Fantasy Trader standing aside.
Recap

Recall that last night I said "we're closing higher on Wednesday".  Well it sure wasn't looking good early on, but once again, as we've been seeing so often lately, the bulls blocked the bears and battled back for a win in all three major averages.  Admittedly, the Dow gained just 6 points, but hey, green is green.  Tomorrow is likely to be tricky - let's try and figure it out.


The technicals

The Dow: Some crazy session today, eh?  At 10:20 AM it was looking like the rally was kaput.  But after marching downhill for just an hour, the Dow came in for a landing and then took off right back up again, to end with yet another hanging man.  That makes, in the last three days, hanging man, star, hanging man.  I hate to sound like a broken record, but none of these reversal warnings are giving us a reversal.   In an ongoing uptrend like this, I will absolutely require confirmation before calling the Dow lower.  And so far, I'm still not seeing it.

When it comes, and it will come eventually, I will have missed the top.  But that's much better than calling for a reversal every day and not getting one.

The VIX:  I got this one plain wrong last night - I thought we had a shot at a lower VIX today but instead it gained 2.89%, coming with a bullish stochastic crossover.  Now I'm thinking the VIX goes higher Thursday and that's bad for stocks.

Market index futures: All three futures just turned negative at 1:27 AM EST.  Like the Dow, ES has been rife with reversal warnings lately.  Today it gave us its third hanging man in a row.  But all three have been higher than the ones before.  And ironically, the overnight action so far anyway is also forming, yes, yet another hanging man.  And the indicators are all oversold-broken.

So you can't believe the candles, you can't believe the indicators, what can you believe?  The regression trend channel to the rescue.  Right now, we've moved right the the edge of the rising RTC from 2/1.  That is a bearish setup.

ES daily pivot: Rose from 1340.75 to 1344.50 tonight.  And we are once again above even this number.  As long as we hold above it, there's no reversal coming.

Dollar index: Actually closed higher from a gap-down open.  That signals at least the possibility of higher Thursday, but it's far from certain.

Morningstar Market Fair Value Index: For the third day in a row the index remained at 0.96.  The fact that it appears to be pooping out at this level now is cause for at least a bit of concern.


History: According to The Stock Traders Almanac, Thursday is historically only very slightly bullish.

     And the winner is...

Very very tough to say.  The technicals seem to be starting to show at least a few signs of weakness, though no outright reversal just yet.  But right now we're pretty much just waiting for those freakin' Greeks again.  After kicking their latest can down the road for four days straight, we're supposedly going to get some sort of news (again) on Thursday that will resolve the question of whether or not the Greeks will accept retiring at age 50 instead of 49 or whatever the hold-up is.  I think that's really what all these dojis have been about all week so far.  And with all that uncertainty in the air, it would be foolhardy of me to call anything right now without technical confirmation.

So it's really pretty simple: Greece reports good news, market goes  up.  Greece reports bad news, market goes down.  Greece keeps kicking the can, market goes nowhere.  On Thursday, don't watch the charts, watch the news.

ES Fantasy Trader

I held on and held on to this trade as long as I dared, finally giving up at 1:11 AM with a  quarter point profit.  But hey I'll take it - that still beats a quarter point loss.  Tonight, we're going to stand aside.  This may be an ES fantasy trade, but it's not wild gambling.  I'm not putting on any trades where I don't feel I have an edge and tonight's one of those times.

Portfolio stats: the account is now $108,375 after 11 trades (8 wins, 3 losses) starting from $100,000 on 1/1.

SLD    10    ES    false    MAR12 Futures     1,347.000    USD    GLOBEX    01:10:49
BOT    10    ES    false    MAR12 Futures     1346.75    USD    GLOBEX    FEB 8 01:38:53  


Wednesday, February 8, 2012

More gains possible Wednesday

The Hoot 
Actionable ideas for the busy trader delivered daily right up front
  • Wednesday higher, medium confidence.
  • ES pivot 1340.75.  Holding above is bullish.
  • Rest of week bias higher technically.
  • Monthly outlook: bias up.
  • ES Fantasy Trader goes long at 1346.75.
Recap

Last night I called for a slightly lower close today and while the market did open lower, it rallied back as we've seen so often lately through the day to close higher by 33 points, apparently on expectations that things are improving in Greece.  Where to next?  Let's see...

The technicals

The Dow: Today's candle was a star, and like yesterday's hanging man, it is ordinarily a sign of indecision.  But all year so far, the decisions, when they come, all seem to be in the upward direction.  We finally got an oversold indication from RSI today but not from the stochastic, which is generally more accurate.  I do not see a top on this chart yet.  We remain firmly inside the rising RTC and today's close at 12,878 finally moves us above the 12,850 resistance line and even two points above last year's intraday high.  There's no resistance now until 13,000 which is both psychological and the "spring shelf" from 2008.

The VIX:  The VIX finally put in a rational candle, declining 0.62% on a small red candle.  With a close at 17.65, a general downtrend, and two recent stabs down to 16.10, I'm thinking there's more downside potential here on Wednesday, and that would be good for stocks.

Market index futures:Tonight all three futures are up, with ES gaining 0.15% at 1:40 AM EST.   This continues the five day winning streak for ES with no sign of reversal.  The indicators are all overbought but they're basically "overbought broken".  The market no longer seems to care about this.  Last month we were overbought for 12 straight sessions before getting a pullback.  We're also still well inside the rising RTC, so no signs of a reversal here yet.

ES daily pivot: Rose again from 1336.58 to 1340.75 tonight.  This brings us a bit closer to the pivot but we remain above as ES continues to drift slowly higher in the overnight.  Again, I see nothing negative here.

Dollar index: The dollar broke out of an eight day trading range to the downside today on the strength of the euro.  There's nothing on this chart to suggest a reversal either.  So a lower dollar would be good for stocks on Wednesday.

Morningstar Market Fair Value Index: Yesterday the index remained at 0.96.  The uptrend remains in place, a positive sign.


History: According to The Stock Traders Almanac, Wednesday is historically on the bearish side and the weakest day of this week.

     And the winner is...

I have to say tonight it's looking like the bulls remain in control so I'll say we're closing higher on Wednesday.  Although I have to think a pullback is coming soon, I just don't see it right now.  And as they say, you can't fight the tape.

ES Fantasy Trader

Tonight I had enough and threw in the towel on yesterday's short.  This market just refuses to go down and there's no point arguing with it, so I just took the 12.5 point loss.  Ugh.  Tonight we go long at 1346.75.

Portfolio stats: the account is now $108,250 after 10 trades (7 wins, 3 losses) starting from $100,000 on 1/1.
BOT    10    ES    false    MAR12 Futures     1346.50    USD    GLOBEX    01:10:18
SLD    10    ES    false    MAR12 Futures     1334.00    USD    GLOBEX    FEB 6 01:47:03

Tuesday, February 7, 2012

Tuesday a bit lower but watch Greek news

The Hoot 
Actionable ideas for the busy trader delivered daily right up front
  • Tuesday lower, low confidence.
  • ES pivot 1336.58.  Breaking under is bearish.
  • Rest of week bias lower technically.
  • Monthly outlook: bias up.
  • ES Fantasy Trader remains short at 1334.00.
Recap

I figured we'd go lower today and so we did, although the entire drop came right out the gate and the market spent the rest of the day playing catch up, finishing down just 17 points despite renewed rumblings from Greece.  I find it interesting that the sort of news that last summer would have resulted in a triple digit dive, today barely moved the needle.  Can we continue pushing higher on Tuesday?  Let's consult the crystal ball.

The technicals

The Dow: Today the Dow gave us a little toy hanging man for a candle.  Is this a reversal sign?  Well, during the current uptrend, the last two hammers were actually followed by moves higher.  With the clear positive bias to the market this year so far, I'd hesitate to call Tuesday lower on the basis of this candle.  Note also that we're still not overbought in any of my Fave Five indicators.

The VIX:  My call for a higher VIX today worked out nicely with the VIX up 3.86% stopping just short of its resistance at 18.  But what to make of the big tall hammer, or is it a hanging man.  With no clear trend, it's hard to say.  Even the indicators aren't particularly clear at this point.  I'm going to have to take a pass on where the VIX goes tomorrow, which is a shame since that's normally one of my favorite markers for the next day's movement.

Market index futures: All three are just barely in the red at 1:40 AM.  ES is down just a quarter point at 1338.75.  It also put in a small hanging man.  However, tonight's action neither confirms nor dispels that, and we do remain within the rising RTC.  The only reversal warnings I see are from the indicators which are now all overbought.  But recall they can stay that way for a while before the trend ends.

ES daily pivot: Rose from 1333.67 to 1336.58 tonight.  With ES running basically flat since the close today, that now puts us very close to this level, though still above, which is a good sign.

Dollar index: In keeping with the odd action of late, the dollar today gained 0.16% on a big red gap-up candle.  It's acting like it wants to rise but isn't quite up to the task.  So we remain stuck in the range going back to January 27th.  No real guidance here.

Morningstar Market Fair Value Index: No update given on the MS web site.


History: According to The Stock Traders Almanac, Tuesday historically has no significant bias either way.

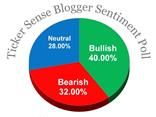
Sentiment: It's the start of a new week so once again it's time for the TickerSense Blogger Sentiment Poll.  We continue to track the poll to see how well it performs.  Here's how things stack up so far this year:


Week   % Bullish  % Bearish  NightOwl SPX  Accuracy

1/3         46        21        +     1258   1/1
1/9         56        37        +     1278   2/2
1/17        41        33        +     1289   3/3
1/23        46        32        +     1315
1/30        48        31        +     1316
2/6         56        30        +     1345

Again, the SPX number is the closing price of the S&P on the Friday before each new poll comes out.  The "NightOwl" column is how I voted.  Since the poll is for 30 days out, after the first four weeks we're able to see how well we did.  This week we see that my bullish call on 1/17 was correct, the S&P now being higher than then.  I'm using the column "Accuracy" to track my calls.  So now I'm 3 for 3.  And of course that means that since I voted with the majority, the poll as a whole was also correct that week.  So far, the contrarian "majority is always wrong" theory still isn't looking too good.


I note that the bullish sentiment is back to 56% while the bears barely changed.  So we're still not seeing the sort of decline in bearish sentiment that would lead to a contrarian bearish call.  I voted positive again this week, but this may be the last time for a while. 


     And the winner is...


If this was a weather forecast, it would be "light and variable".  I'm still not seeing any signs of an imminent decline, but the market is also clearly having some trouble getting past the 12,850 level.  The old crystal ball is just a bit murky tonight.  My best guess is that the current pause may continue another day or so, so I'll call Tuesday's close slightly lower.  But, and this is a big but,, there's supposed to be some more news from Greece coming out and that's sure to have an impact on prices.  No chart can predict that, so keep one eye on the news ticker for that.

ES Fantasy Trader

Tonight we remain short at 1334.00.  If this doesn't pan out tomorrow, I will seriously consider giving up on it..

Portfolio stats: the account remains $114,500 after 9 trades (7 wins, 2 losses) starting from $100,000 on 1/1.
 

Monday, February 6, 2012

Monday looking lower

The Hoot 
Actionable ideas for the busy trader delivered daily right up front
  • Monday lower, medium confidence.
  • ES pivot 1333.67.  Breaking under is bearish.
  • Rest of week bias lower technically.
  • Monthly outlook: bias up.
  • ES Fantasy Trader goes short at 1334.00.
Recap

As I suspected Thursday night, we did indeed move higher on Friday.  But I was surprised by the strength and breadth of the advance.  There was in fact much hand wringing and tooth-gnashing in the blogosphere about how and why this market simply refuses to go down.  I don't really care about the why's as much as I do simply about being on the right side.  And which side might that be on Monday?  Read on...

The technicals

The Dow: The Dow went out like gangbusters on Friday, shooting up 157 points to close at levels not seen since May of 2008, although last year's intraday high was a bit above this on May 2nd.  Interestingly, while back then we were very overbought indeed, right now the Dow's daily indicators, though rising, still have not reached those levels yet.  And we remain firmly in the rising RTC going back to December 29th, 2011.

That said, we can consider Friday to have closed right on a resistance line.  Although we have finally cleared the "summer shelf" from 2008 around 11,685, we now have to deal with the spring shelf of 2008 around 13,000.   I think the Dow's in much better shape to mount an assault on this level than it was the last time around, last May.  This chart, in fact doesn't look bad at all.

The VIX:  Perhaps the most telling chart tonight is the VIX, which took quite a gap down on Friday to close at 17.10, a level not seen since last July 22nd, just before the Europe-fueled summer insanity of 2011.  But there are two important things here: first the VIX formed a clear hammer, and second, it did it by piercing the lower BB.  As I've noted before, the VIX rarely goes lower after breaking under the lower BB.  This would seem to suggest a higher VIX on Monday and that would be bad for stocks.

Market index futures: Friday's tall green candle isn't a reversal sign, but the fact that it closed almost two points above the upper BB is.  Moving out to the weekly chart, it appears that the ES indicators have now peaked in overbought territory  Add in the fact that we've got no positive follow-through in the overnight and it's looking like we may be in for a pause.

ES daily pivot: Rose once again from 1321.92 to 1333.67 tonight.  This had the effect of considerably narrowing the distance to the pivot.  Combined with ES opening lower and drifting down from there in the overnight so far, we'll need to watch this level.  If ES breaks under the pivot that's bearish for sure.

Dollar index: Meanwhile, the dollar on Friday remained stuck in what's now a 7 day trading range.  Once again, not much to learn from this chart.

Morningstar Market Fair Value Index: On Friday the index rose again to 0.96 extending a run from 0.83 on December 19th.  While this is still positive for stocks, the approach of the 1.0 level is definitely a caution sign.


History: According to The Stock Traders Almanac,Monday historically has a small bearish bias to it.

     And the winner is...

I'm going to have to say it's the bears.  Although the Dow chart's in pretty good shape, the ES and the VIX are both suggesting a lower close Monday.  That's my story and I'm sticking to it.

In fact we just might see a few days of retrenchment here before the next leg up.  But let's get Monday out of the way first.  We'll see.

ES Fantasy Trader

Last Friday's long trade worked out nicely and I rang the register just before lunch time with a tidy16.5 point gain.  Not too shabby.  Tonight we go short at 1334.00 at 1:47 AM.

Portfolio stats: the account is now $114,500 after 9 trades (7 wins, 2 losses) starting from $100,000 on 1/1.

SLD    10    ES    false    MAR12 Futures     1339.00    USD    GLOBEX    FEB 3 11:40:44
BOT    10    ES    false    MAR12 Futures     1322.50    USD    GLOBEX    FEB 3 01:57:10